DataJunction + Trino Quickstart
- Prerequisites
- Clone the DataJunction Repository
- Start the Docker Environment
- Access the DataJunction UI
- Verify Trino Tables
- Understand the DataJunction Query Service Configuration
- Add a Matching Catalog and Engine to the Core Service
- Register Tables as Source Nodes
- Define Dimension Nodes
- Define Dimension Links
- Create a Metric
- Retrieving Data from the REST API
On this page
- Prerequisites
- Clone the DataJunction Repository
- Start the Docker Environment
- Access the DataJunction UI
- Verify Trino Tables
- Understand the DataJunction Query Service Configuration
- Add a Matching Catalog and Engine to the Core Service
- Register Tables as Source Nodes
- Define Dimension Nodes
- Define Dimension Links
- Create a Metric
- Retrieving Data from the REST API
This tutorial will guide you through the process of setting up DataJunction, a powerful metrics platform, to work with Trino as the query compute engine. By the end of this tutorial, you’ll have a functional DataJunction instance layered on top of a local dockerized Trino deployment, and you’ll be able to register tables, define dimensions, create metrics, and more.
Prerequisites
- Docker installed on your system.
- Basic knowledge of SQL and REST APIs.
Clone the DataJunction Repository
First, clone the DataJunction GitHub repository to your local machine:
git clone https://github.com/DataJunction/dj.git
cd dj
Start the Docker Environment
Use Docker Compose to start the environment, including the Trino container:
docker compose --profile demo --profile trino up
--profile demo flag is required to launch the DataJunction query qervice
container and the --profile trino flag is required to launch the container running the
official Trino docker image.Access the DataJunction UI
Once the containers are running, navigate to http://localhost:3000 in your web browser to access the DataJunction UI.
Create a new user using basic auth by clicking the Sign Up link.
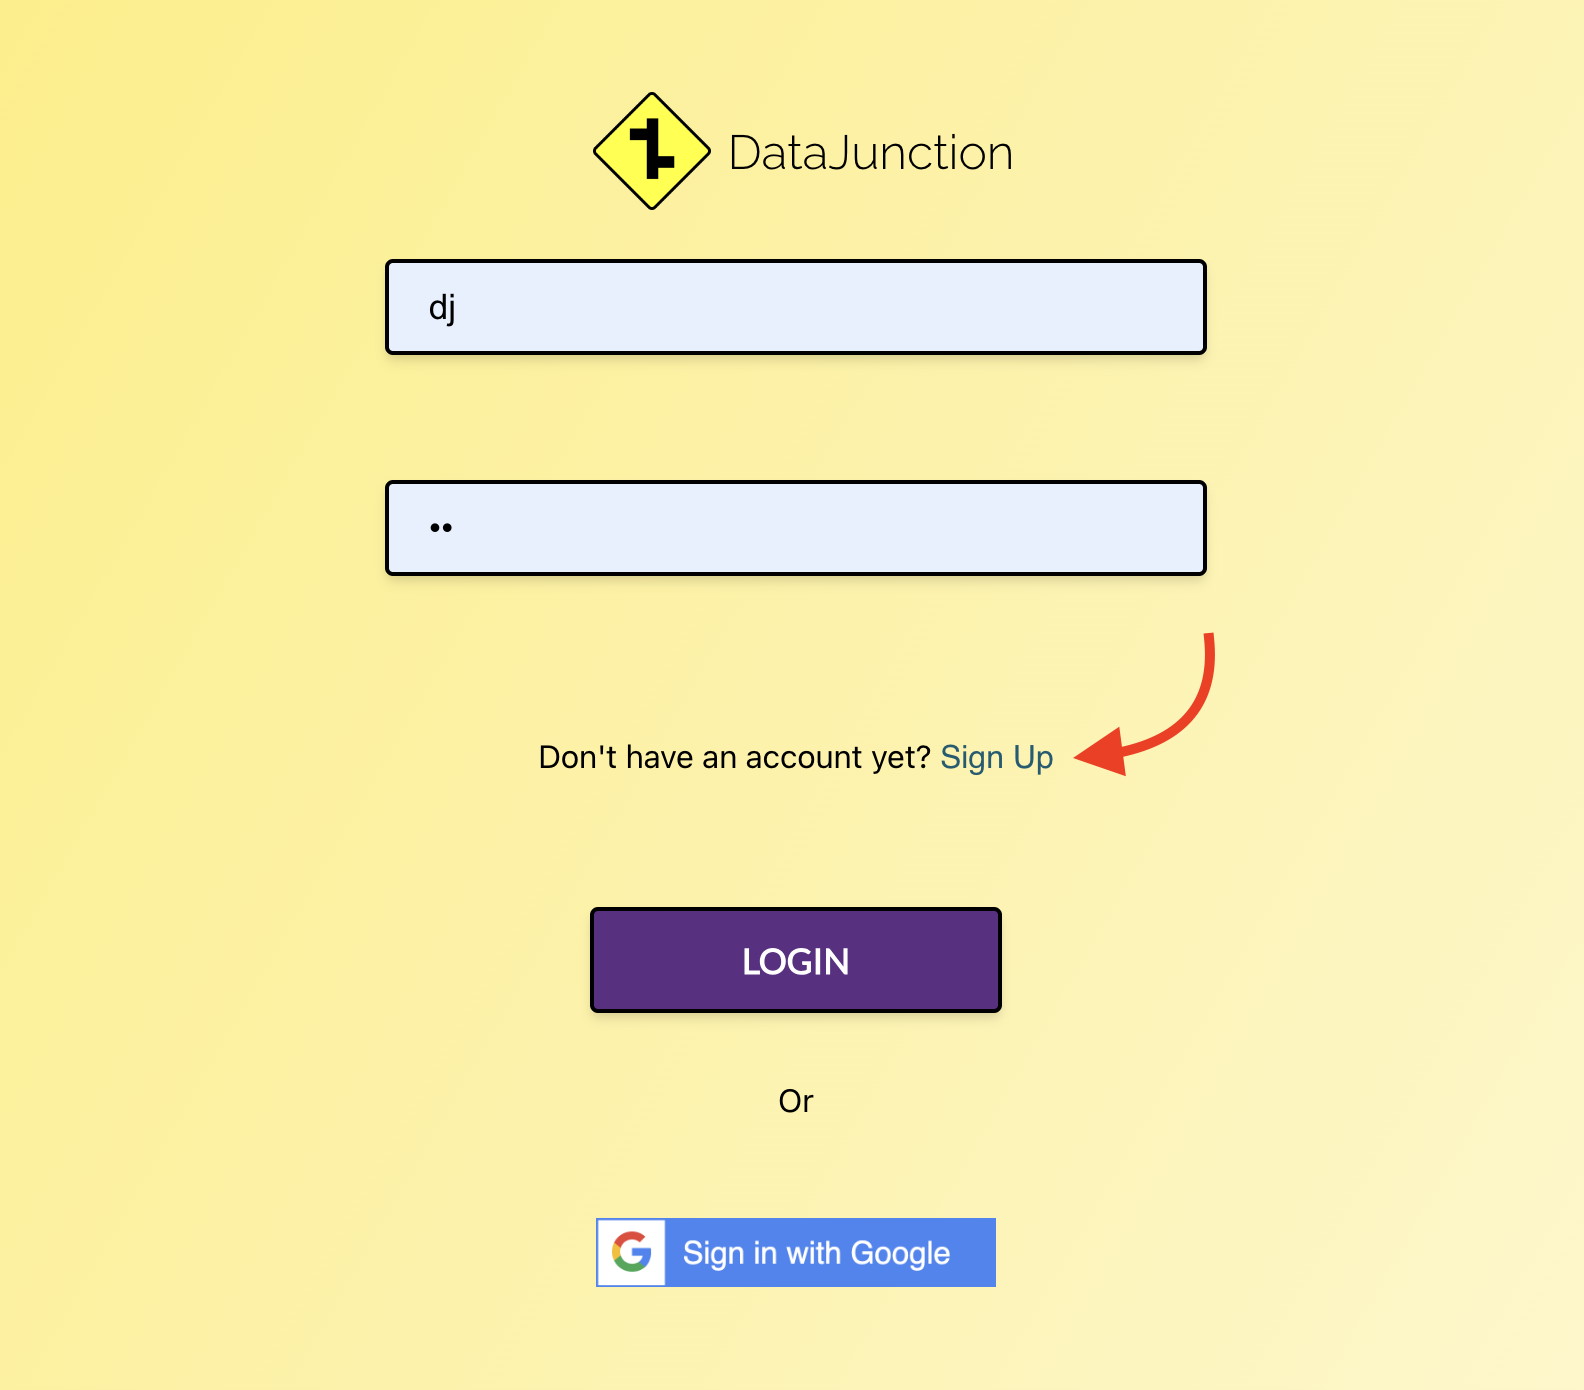
Create a user using any email, username, and password (don’t worry, all of this data will only be stored in
the local postgres instance). In the screenshot below, the email, username, and password were set to
dj@datajunction.io, datajunction, and datajunctionrespectively.
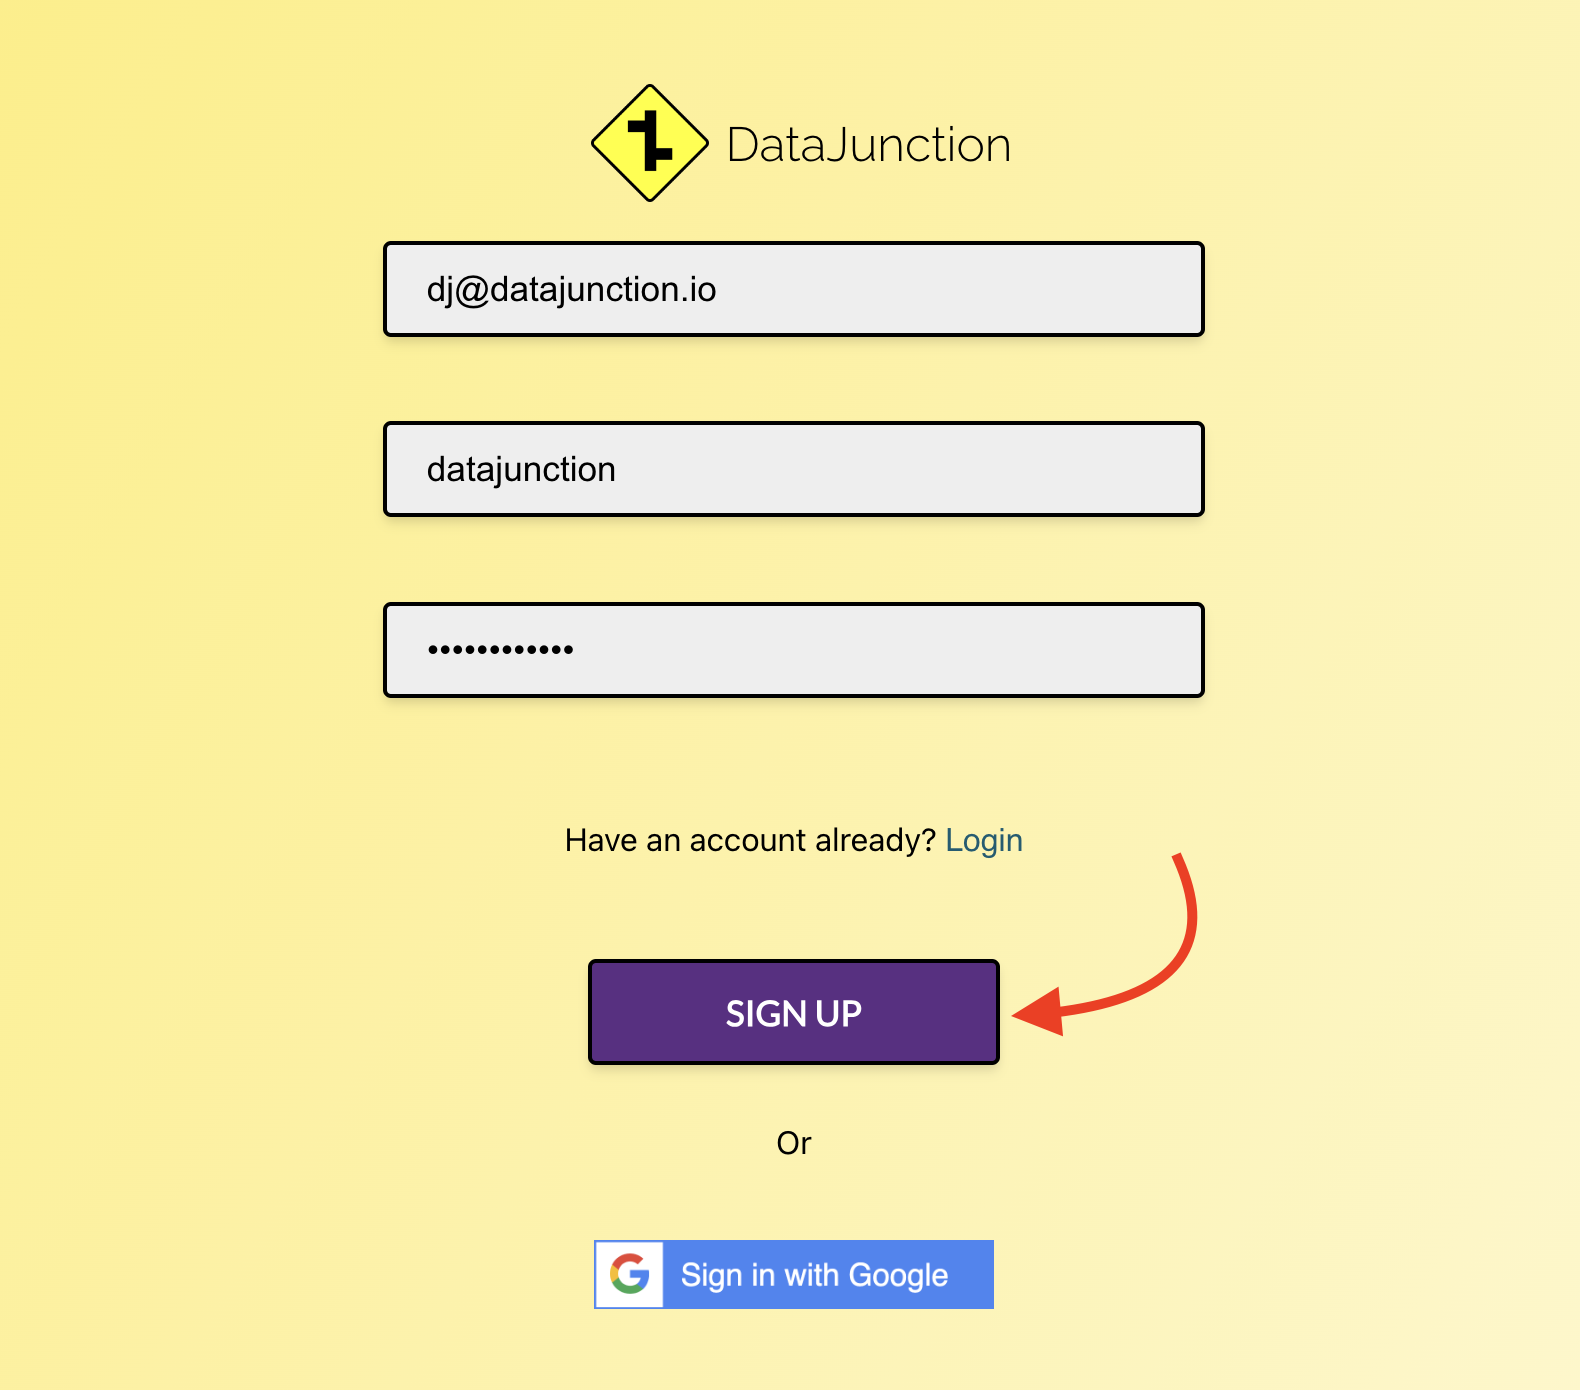
After clicking the sign up button, you’ll be automatically logged in and will be sent to the Explore page.
Verify Trino Tables
Before we start modeling in the DJ UI, let’s verify that the tpch tables are available in the Trino instance. Run the following command to open the Trino CLI:
docker exec -it dj-trino trino --catalog tpch --schema sf1
In the Trino CLI, run the following query to list the tables in the sf1 schema:
SHOW TABLES;
| tables |
|---|
| customer |
| lineitem |
| nation |
| orders |
| part |
| partsupp |
| region |
| supplier |
Understand the DataJunction Query Service Configuration
The file ./datajunction-query/config.djqs.yml contains the configuration for the Trino engine and the tpch catalog.
It contains the necessary settings for the query service to connect to the Trino deployment.
engines:
  - name: trino
    version: 451
    type: sqlalchemy
    uri: trino://trino-coordinator:8080/tpch/sf1
    extra_params:
      http_scheme: http
      user: admin
catalogs:
  - name: tpch
    engines:
      - trino
This configuration defines an engine implementation named trino (the name can be anything) that uses the sqlalchemy
type engine which supports any URI and passes in extra_params as connection arguments. In the demo query service
container, the trino python client is installed which includes the
sqlalchemy engine implementation for Trino.
The tpch catalog is then defined and the trino engine is attached to it.
Add a Matching Catalog and Engine to the Core Service
Although Trino and the TPCH catalog are configured in the query service running on port 8001, the core DataJunction
service running on port 8000 still needs to be made aware of them. Currently, the only way to do this is via the REST
API, but there are plans to provide a simpler mechanism in the future such as a configuration file or a UI page.
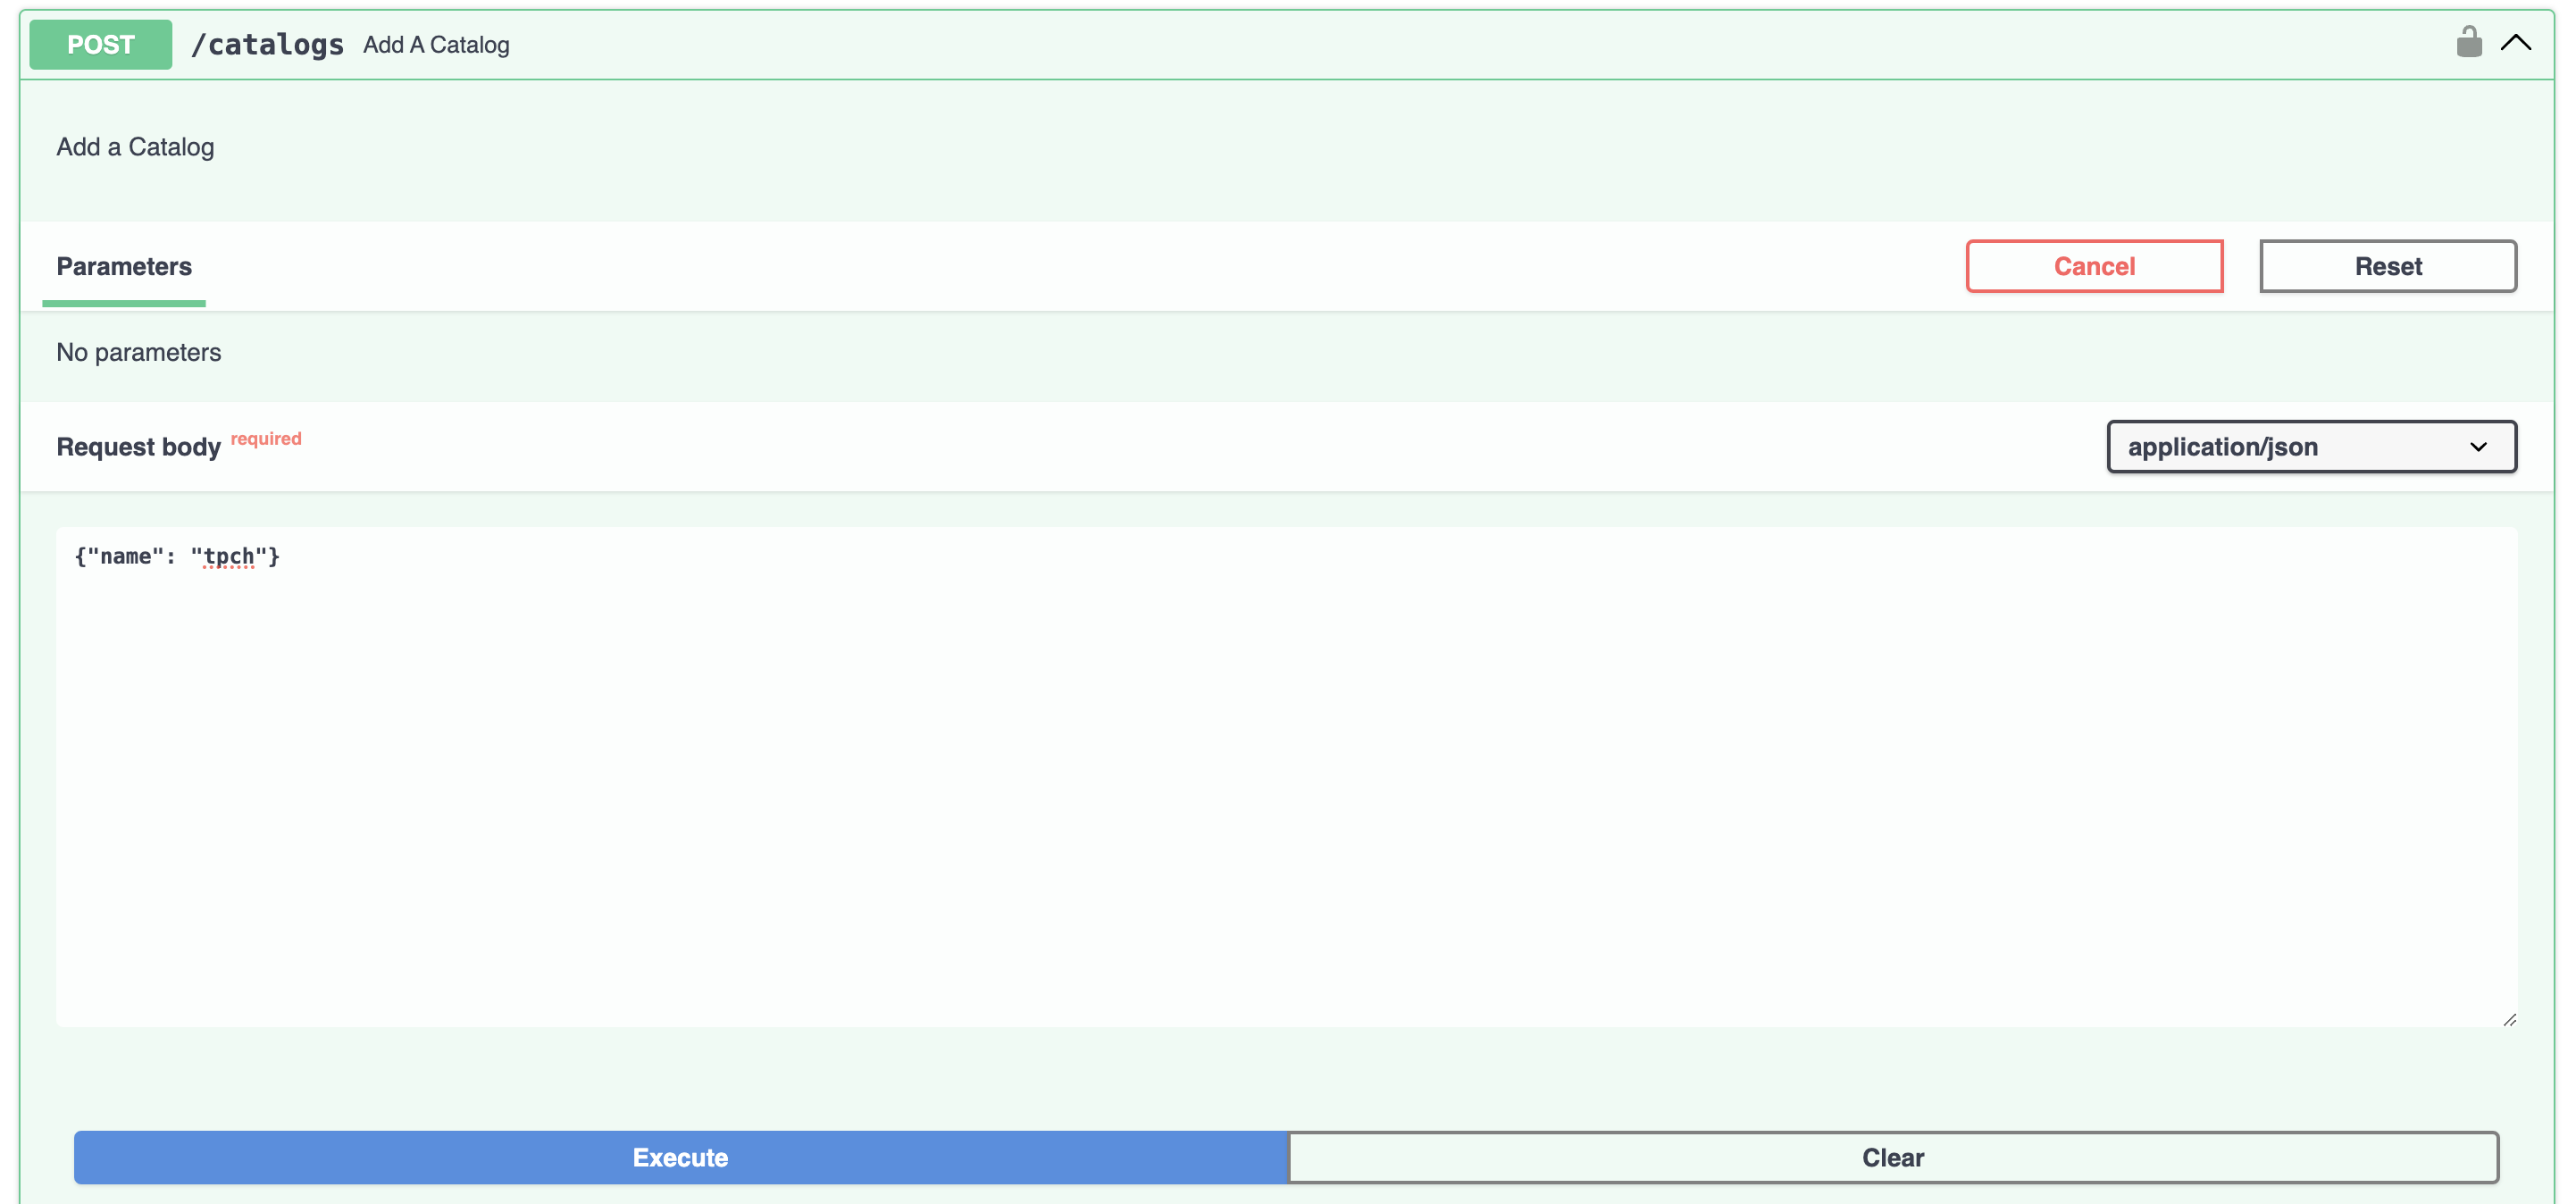
Navigate to the Swagger UI running at http://localhost:8000/docs and scroll to the
POST /catalogs endpoint. For the request body, use {"name": "tpch"}.
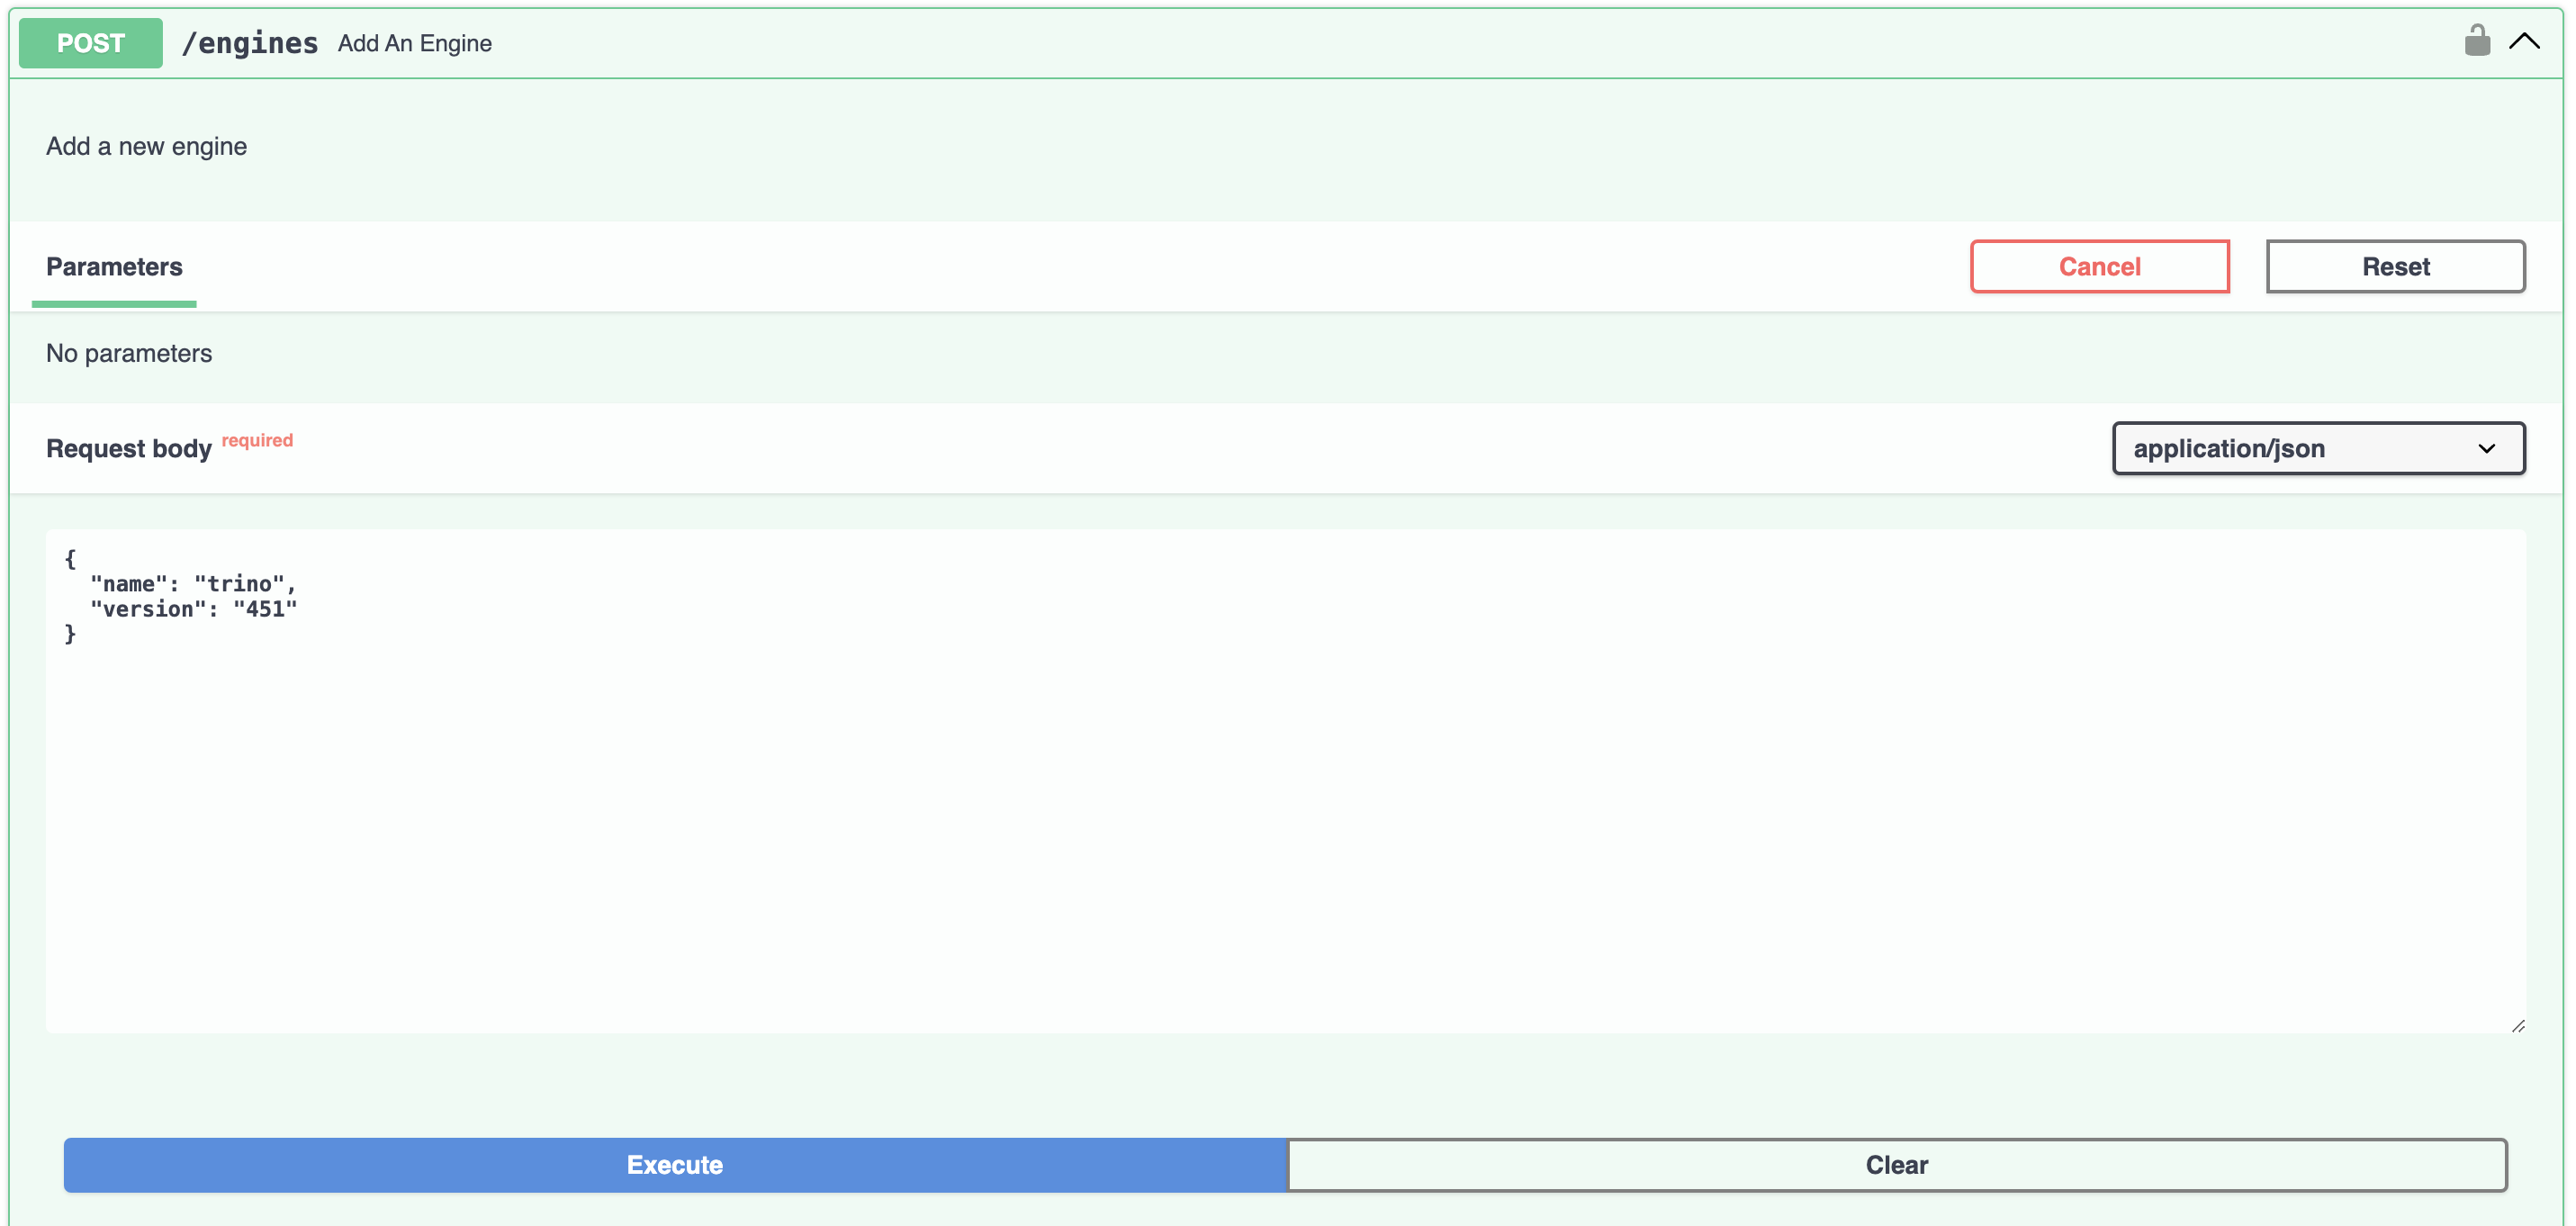
Next, scroll to the POST /engines endpoint. For the request body, use {"name": "trino", "version": "451"}. This
will be included in requests to the query service which will map the queries to the configured Trino connection
information.
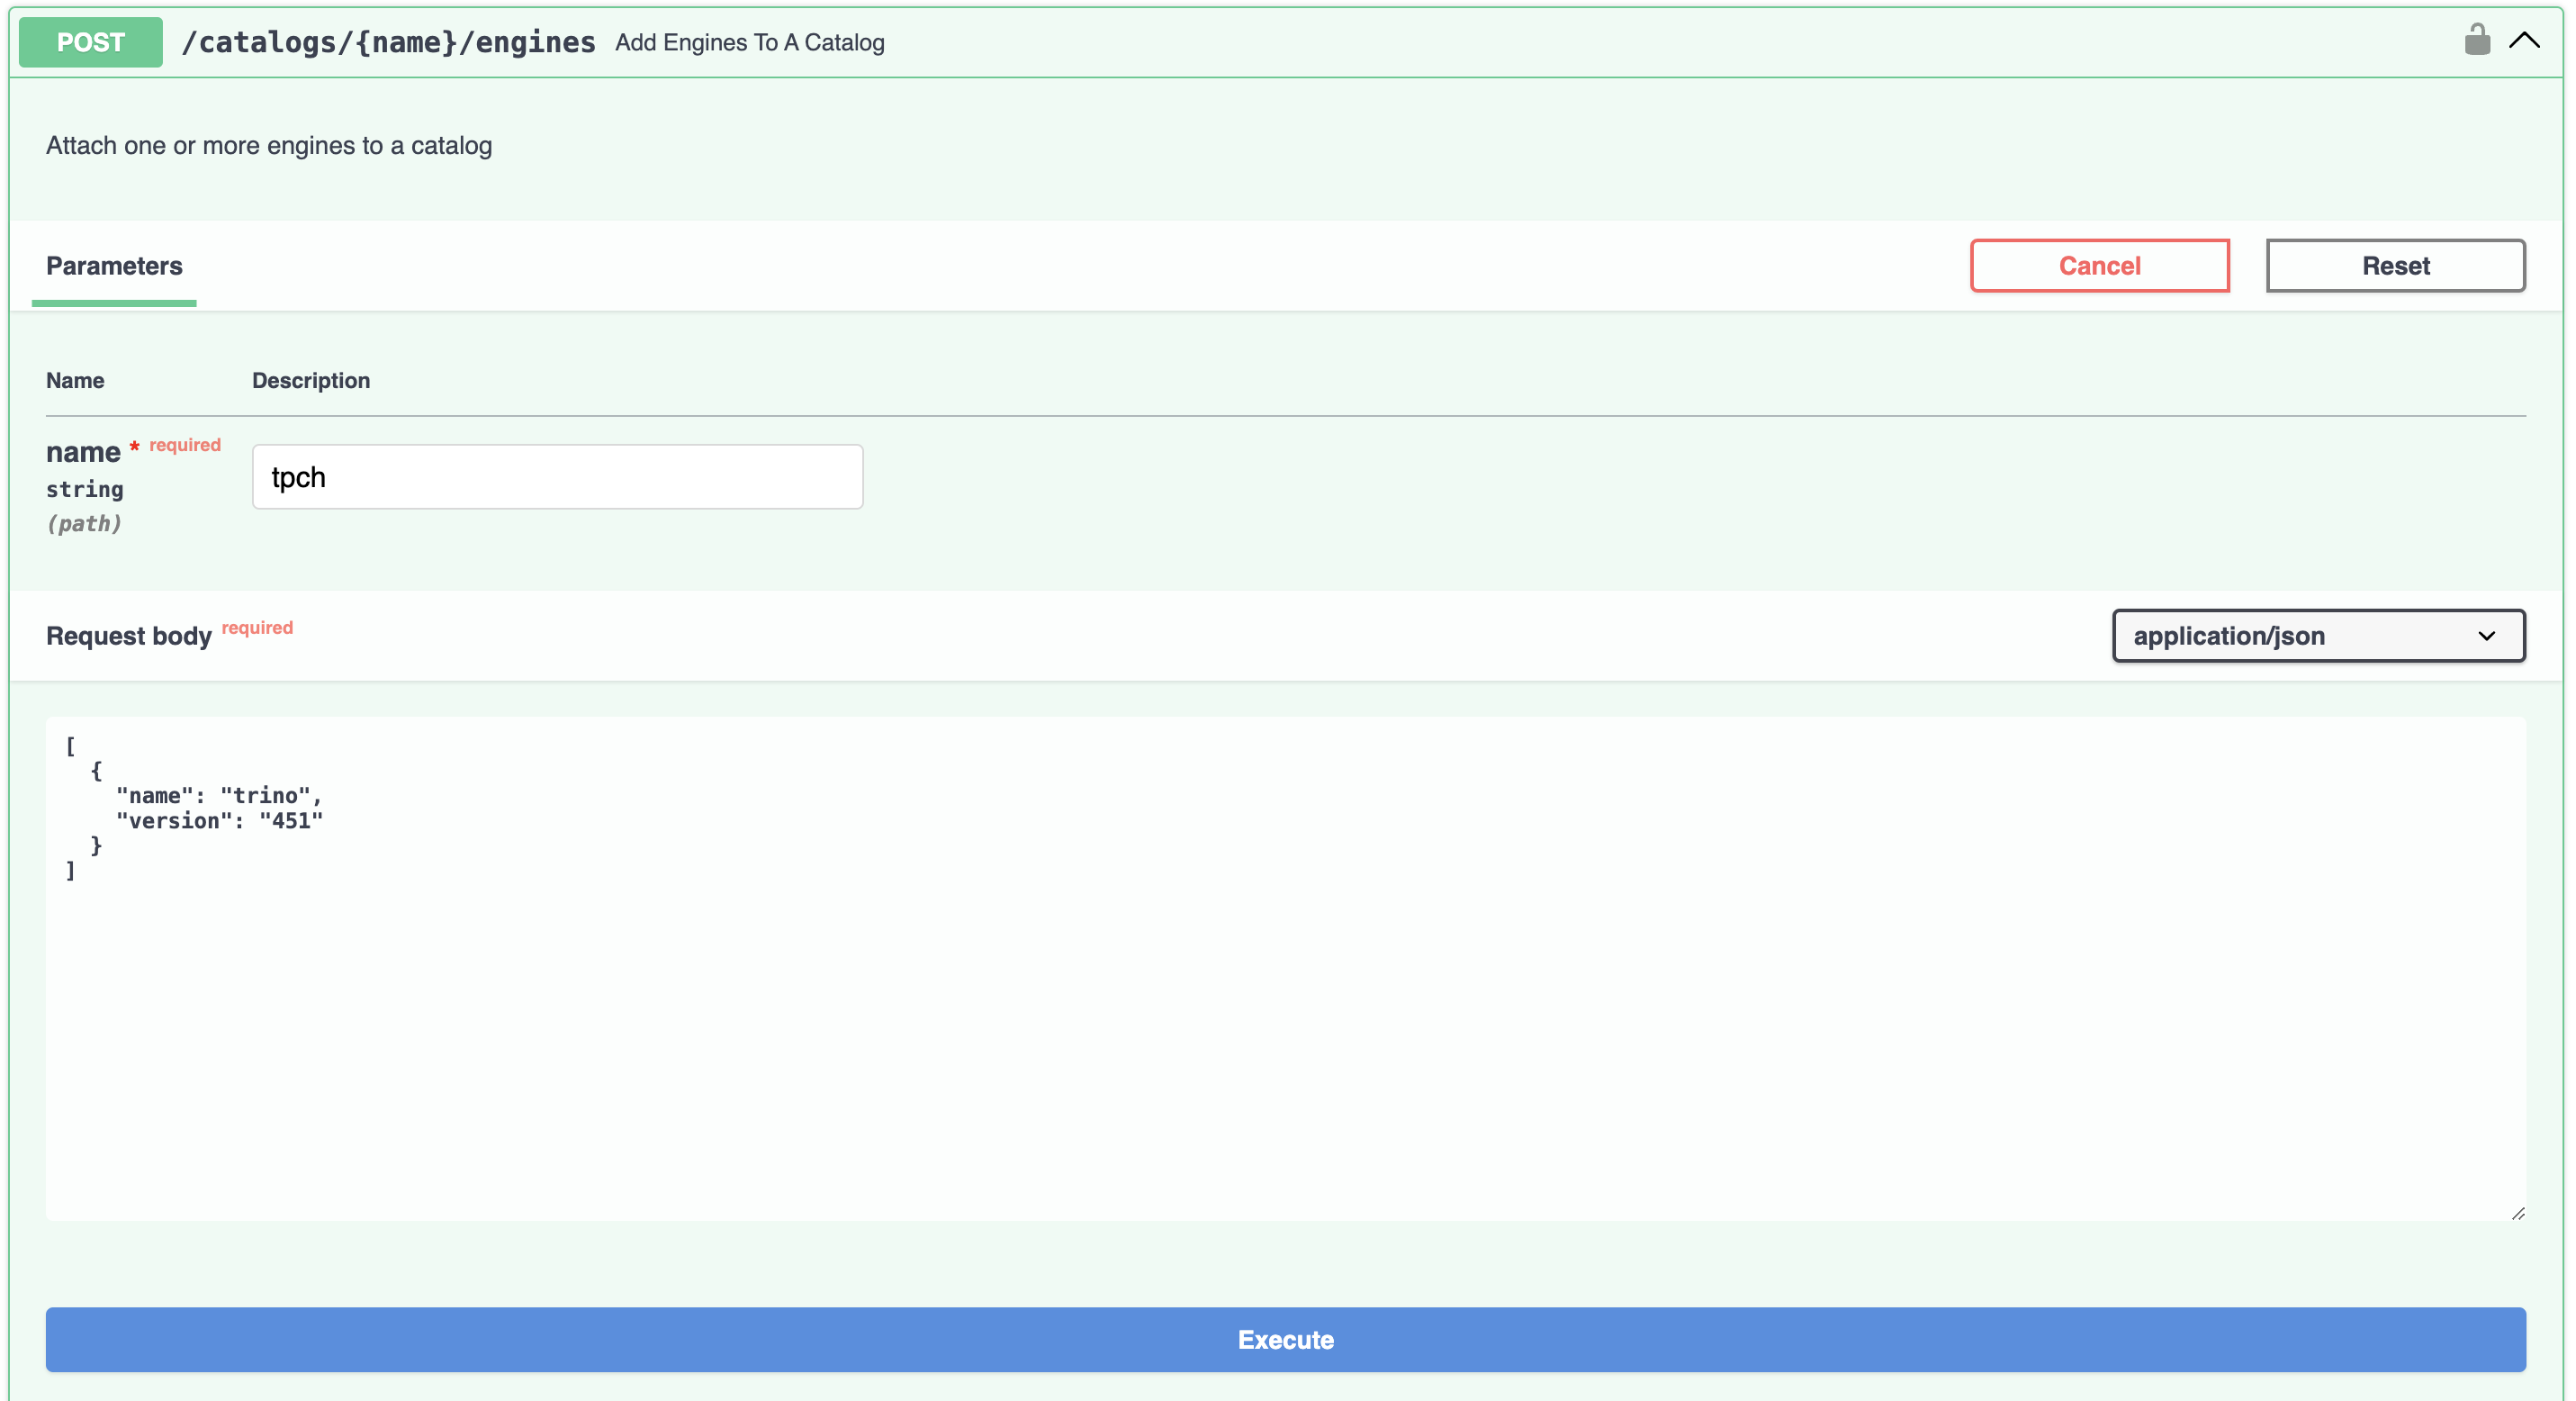
Finally, use the POST /catalogs/{name}/engines endpoint to attach the trino engine to the tpch catalog.
Register Tables as Source Nodes
In the DataJunction UI, you can start registering tables as source nodes:
- Go to the DataJunction UI at http://localhost:3000
- Hover over the
+ Add Nodedropdown and selectRegister Table. - Input each of the tables using
tpchas the catalog andsf1as the schema. They will be automatically registered in thesourcenamespace.
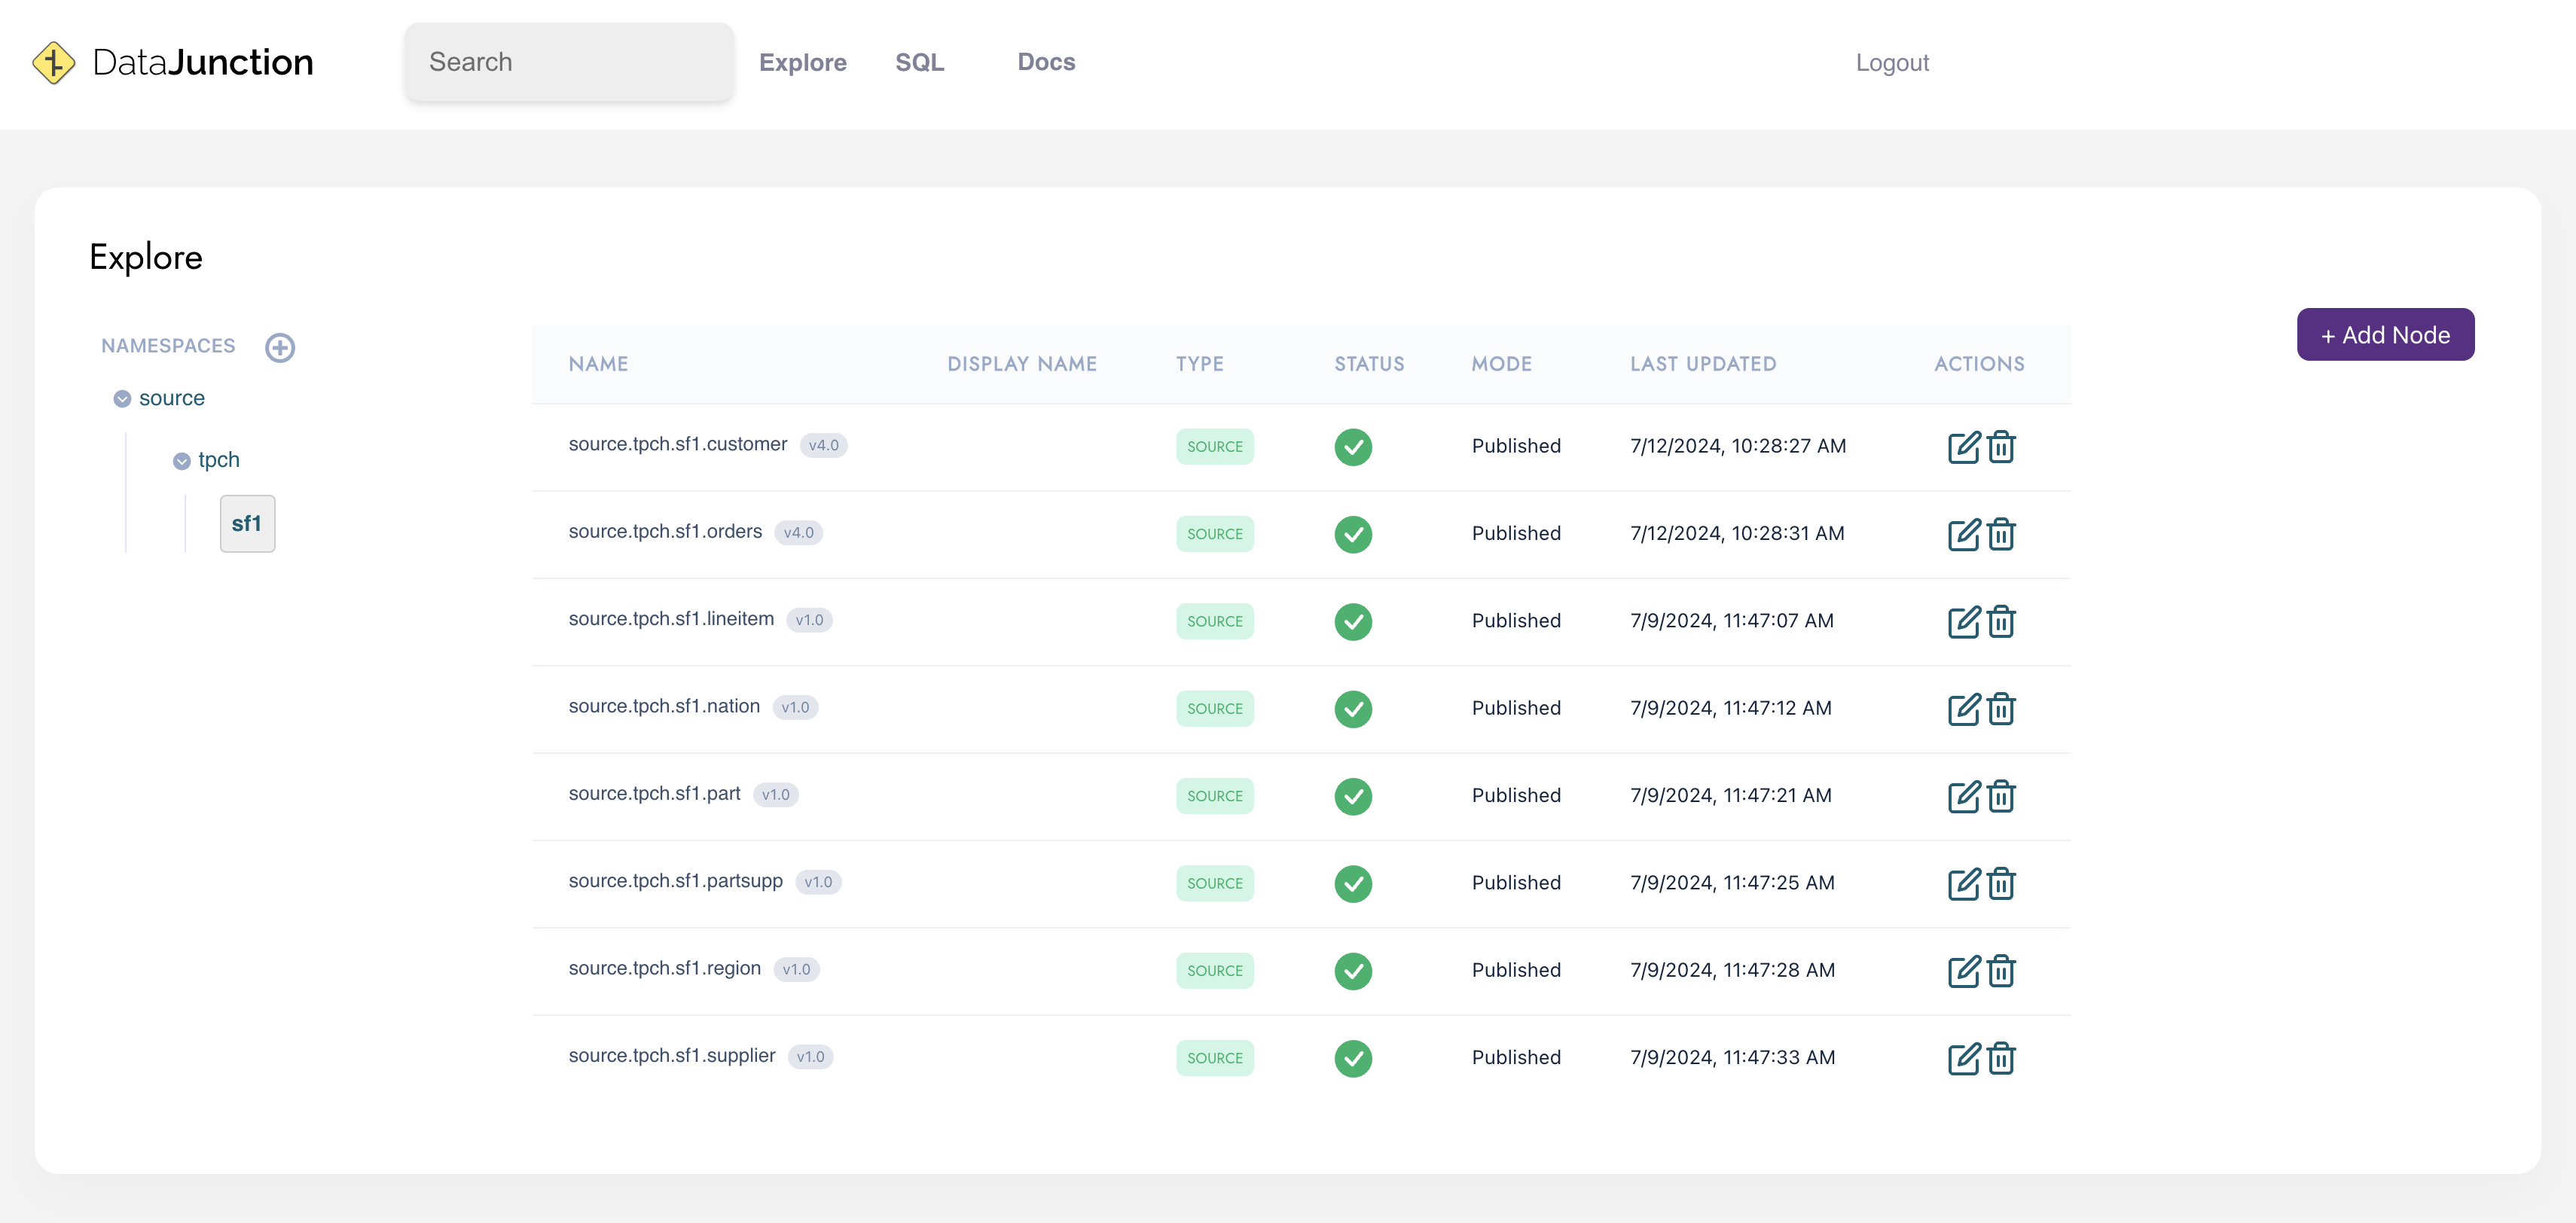
Navigate to the source->tpch->sf1 namespace in the DataJunction UI. You should see all of the tables you just registered.
Define Dimension Nodes
Next, define the dimension nodes based on the TPCH schema. Although dimensions can include arbitrary SQL, for simplicity, we will select all columns from the source nodes:
- Go to the Explore page.
- Next to “Namespaces,” click the pencil icon and create a new namespace called
tpch_dimensions. - Hover over “+ Add Node” and select “Dimension”.
- For namespace, choose
tpch_dimensions. Start by creating thecustomerdimension by selecting all columns from thesource.tpch.sf1.customersource node.
Repeat this process for the other dimension tables.
Define Dimension Links
Now, define the relationships between dimensions, referred to as dimension linking:
- Go to the Columns tab for each source node.
- For example, in the
source.tpch.sf1.orderssource node, go to the Columns tab. - For the
custkeycolumn, click the pencil under Linked Dimension and selecttpch_dimensions.customerfrom the dropdown.
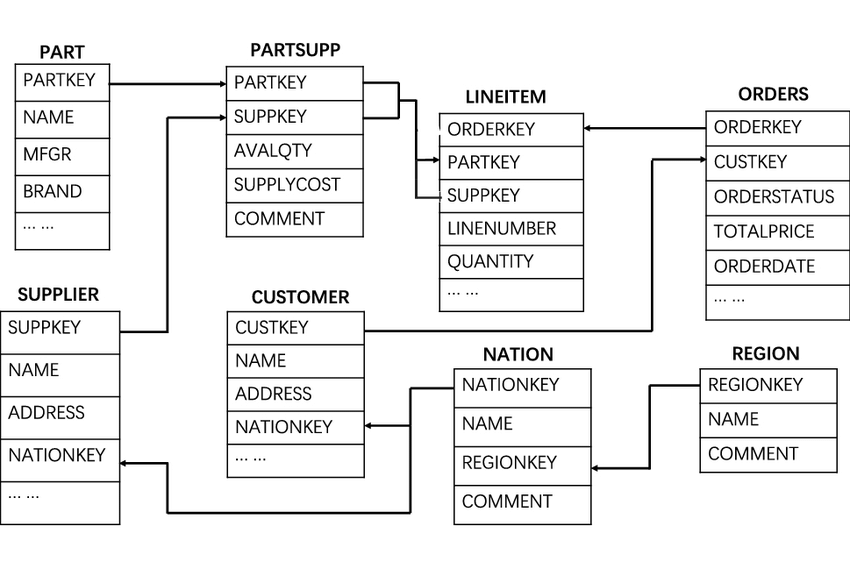
Continue linking dimensions for the relevant columns. Refer to the provided ERD diagram for guidance.
Create a Metric
Create a simple metric to count orders:
- Go to the Explore page and create a namespace called
tpch_metrics. - Hover over “+ Add Node” and select “Metric”.
- Create a metric called
num_orderswith the upstream nodesource.tpch.sf1.ordersand the expressionCOUNT(orderkey).
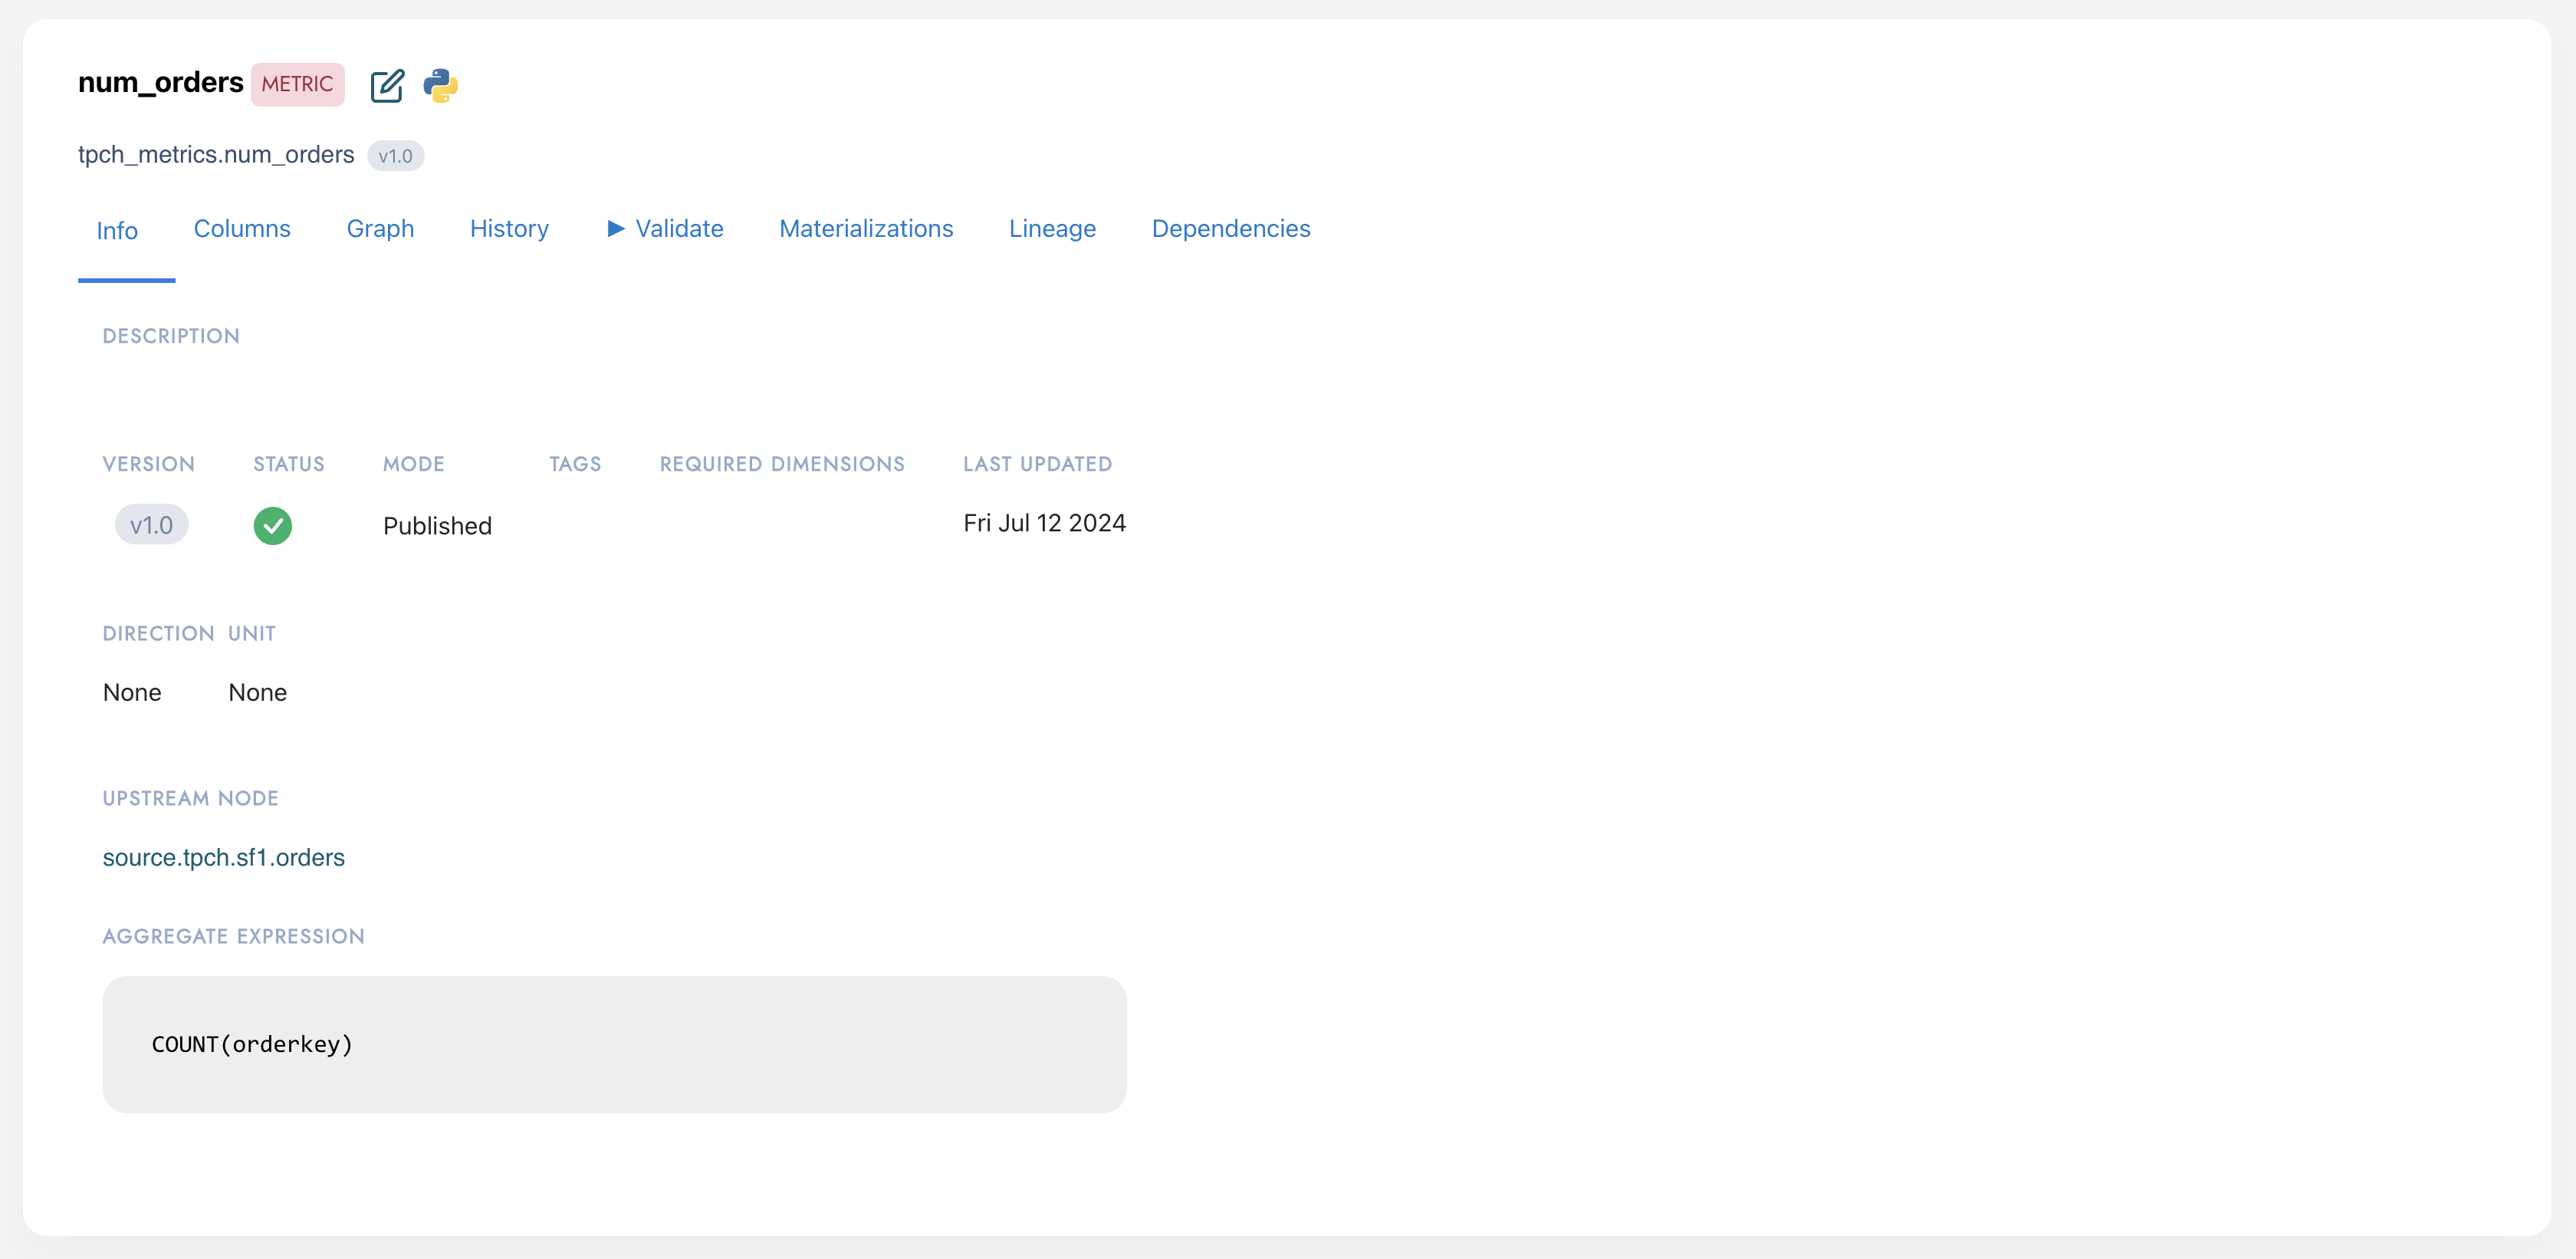
You can also validate the metric directly in the UI to make sure that DataJunction can generate a proper query to retrieve the metric data.
- Go to the metric page and click the Validate tab.
- Click Run Query to confirm that the metric retrieves data from the compute engine. You should see a single row with a number in the query result.
In the Validate tab, use the “Group By” dropdown to group the metric by discovered dimension primary keys, such as Customer, Nation, and Region dimensions.
Retrieving Data from the REST API
The REST API is one of the most common mechanisms to retrieve SQL or data for a combination of metrics and dimensions. To try out the REST API, navigate to the Swagger UI at http://localhost:8000/docs.
- Go to the
/metrics/{name}endpoint and request thetpch_metrics.num_ordersmetric. Review the available dimension attributes. - Use the
/dataendpoint to get data for the number of orders per customer, displaying the market segment attribute from the customer dimension. Addtpch_metrics.num_ordersas a metric andtpch_dimensions.customer.mktsegmentas a dimension. - If you only want to retrieve the SQL query without actually executing it against the compute engine, you can use the
/sqlendpoint which has a request specification almost identical to/data.
After running the query by calling the /data endpoint, you should see the results for the number of orders grouped
by each market segment.